Gno Monitor
gnomonitor is a lightweight Prometheus exporter for Gno/TM2 RPC nodes. It polls Gno RPC endpoints and exposes node health, latest block status, peer count, validator set status, gas metrics, and in-memory validator signing-window metrics.
Repository: ronnynth/gnomonitor
Features
- Gno/TM2 RPC health checks
- Latest block height and timestamp metrics
- Catching-up and peer count metrics
- Validator set and voting power metrics
- Latest block gas metrics
- Optional validator auto-discovery from
/status.validator_info.address - Prometheus
/metricsand HTTP/healthendpoints - Grafana dashboard JSON under
grafana/dashboards/gnomonitor.json
Build
git clone https://github.com/ronnynth/gnomonitor.git
cd gnomonitor

go mod download
go build -o gnomonitor main.go
Cross-compile for Linux amd64:
CGO_ENABLED=0 GOOS=linux GOARCH=amd64 go build \
  -trimpath \
  -ldflags='-s -w' \
  -o dist/gnomonitor-linux-amd64 \
  main.go
Configure
Create config.yaml for a local Docker-based Gno node:
gno:
  - hostname: "gno-test13-rpc"
    http_url: "http://127.0.0.1:26657"
    chain_name: "gno-test13"
    chain_id: "test-13"
    node_version: ""
    protocol_name: "gno"
    check_second: 5
    signing_window: 50
    auto_discover_validator: true
    validator_addresses: []
For a remote public endpoint, use:
gno:
  - hostname: "gno-test13-public"
    http_url: "https://rpc.test13.testnets.gno.land"
    chain_name: "gno-test13"
    chain_id: "test-13"
    node_version: ""
    protocol_name: "gno"
    check_second: 5
    signing_window: 50
    auto_discover_validator: true
    validator_addresses: []
validator_addresses accepts multiple Gno validator addresses. If auto_discover_validator is true, the monitor also adds the validator address reported by the RPC status response when available.
Run
./gnomonitor \
  -conf ./config.yaml \
  -listen.addr :3002 \
  -pprof.addr localhost:6062 \
  -logtostderr=true \
  -v=5
Common server mode:
./gnomonitor \
  -conf ./config.yaml \
  -listen.addr :9108 \
  -pprof.addr "" \
  -logtostderr=true \
  -v=2
Endpoints:
- Metrics:
http://localhost:9108/metrics - Health:
http://localhost:9108/health - pprof, when enabled:
http://localhost:6062/debug/pprof/
Prometheus
scrape_configs:
  - job_name: "gno-nodes"
    static_configs:
      - targets: ["localhost:9108"]
    scrape_interval: 15s
    metrics_path: /metrics
Grafana Dashboard
Import grafana/dashboards/gnomonitor.json from the repository.
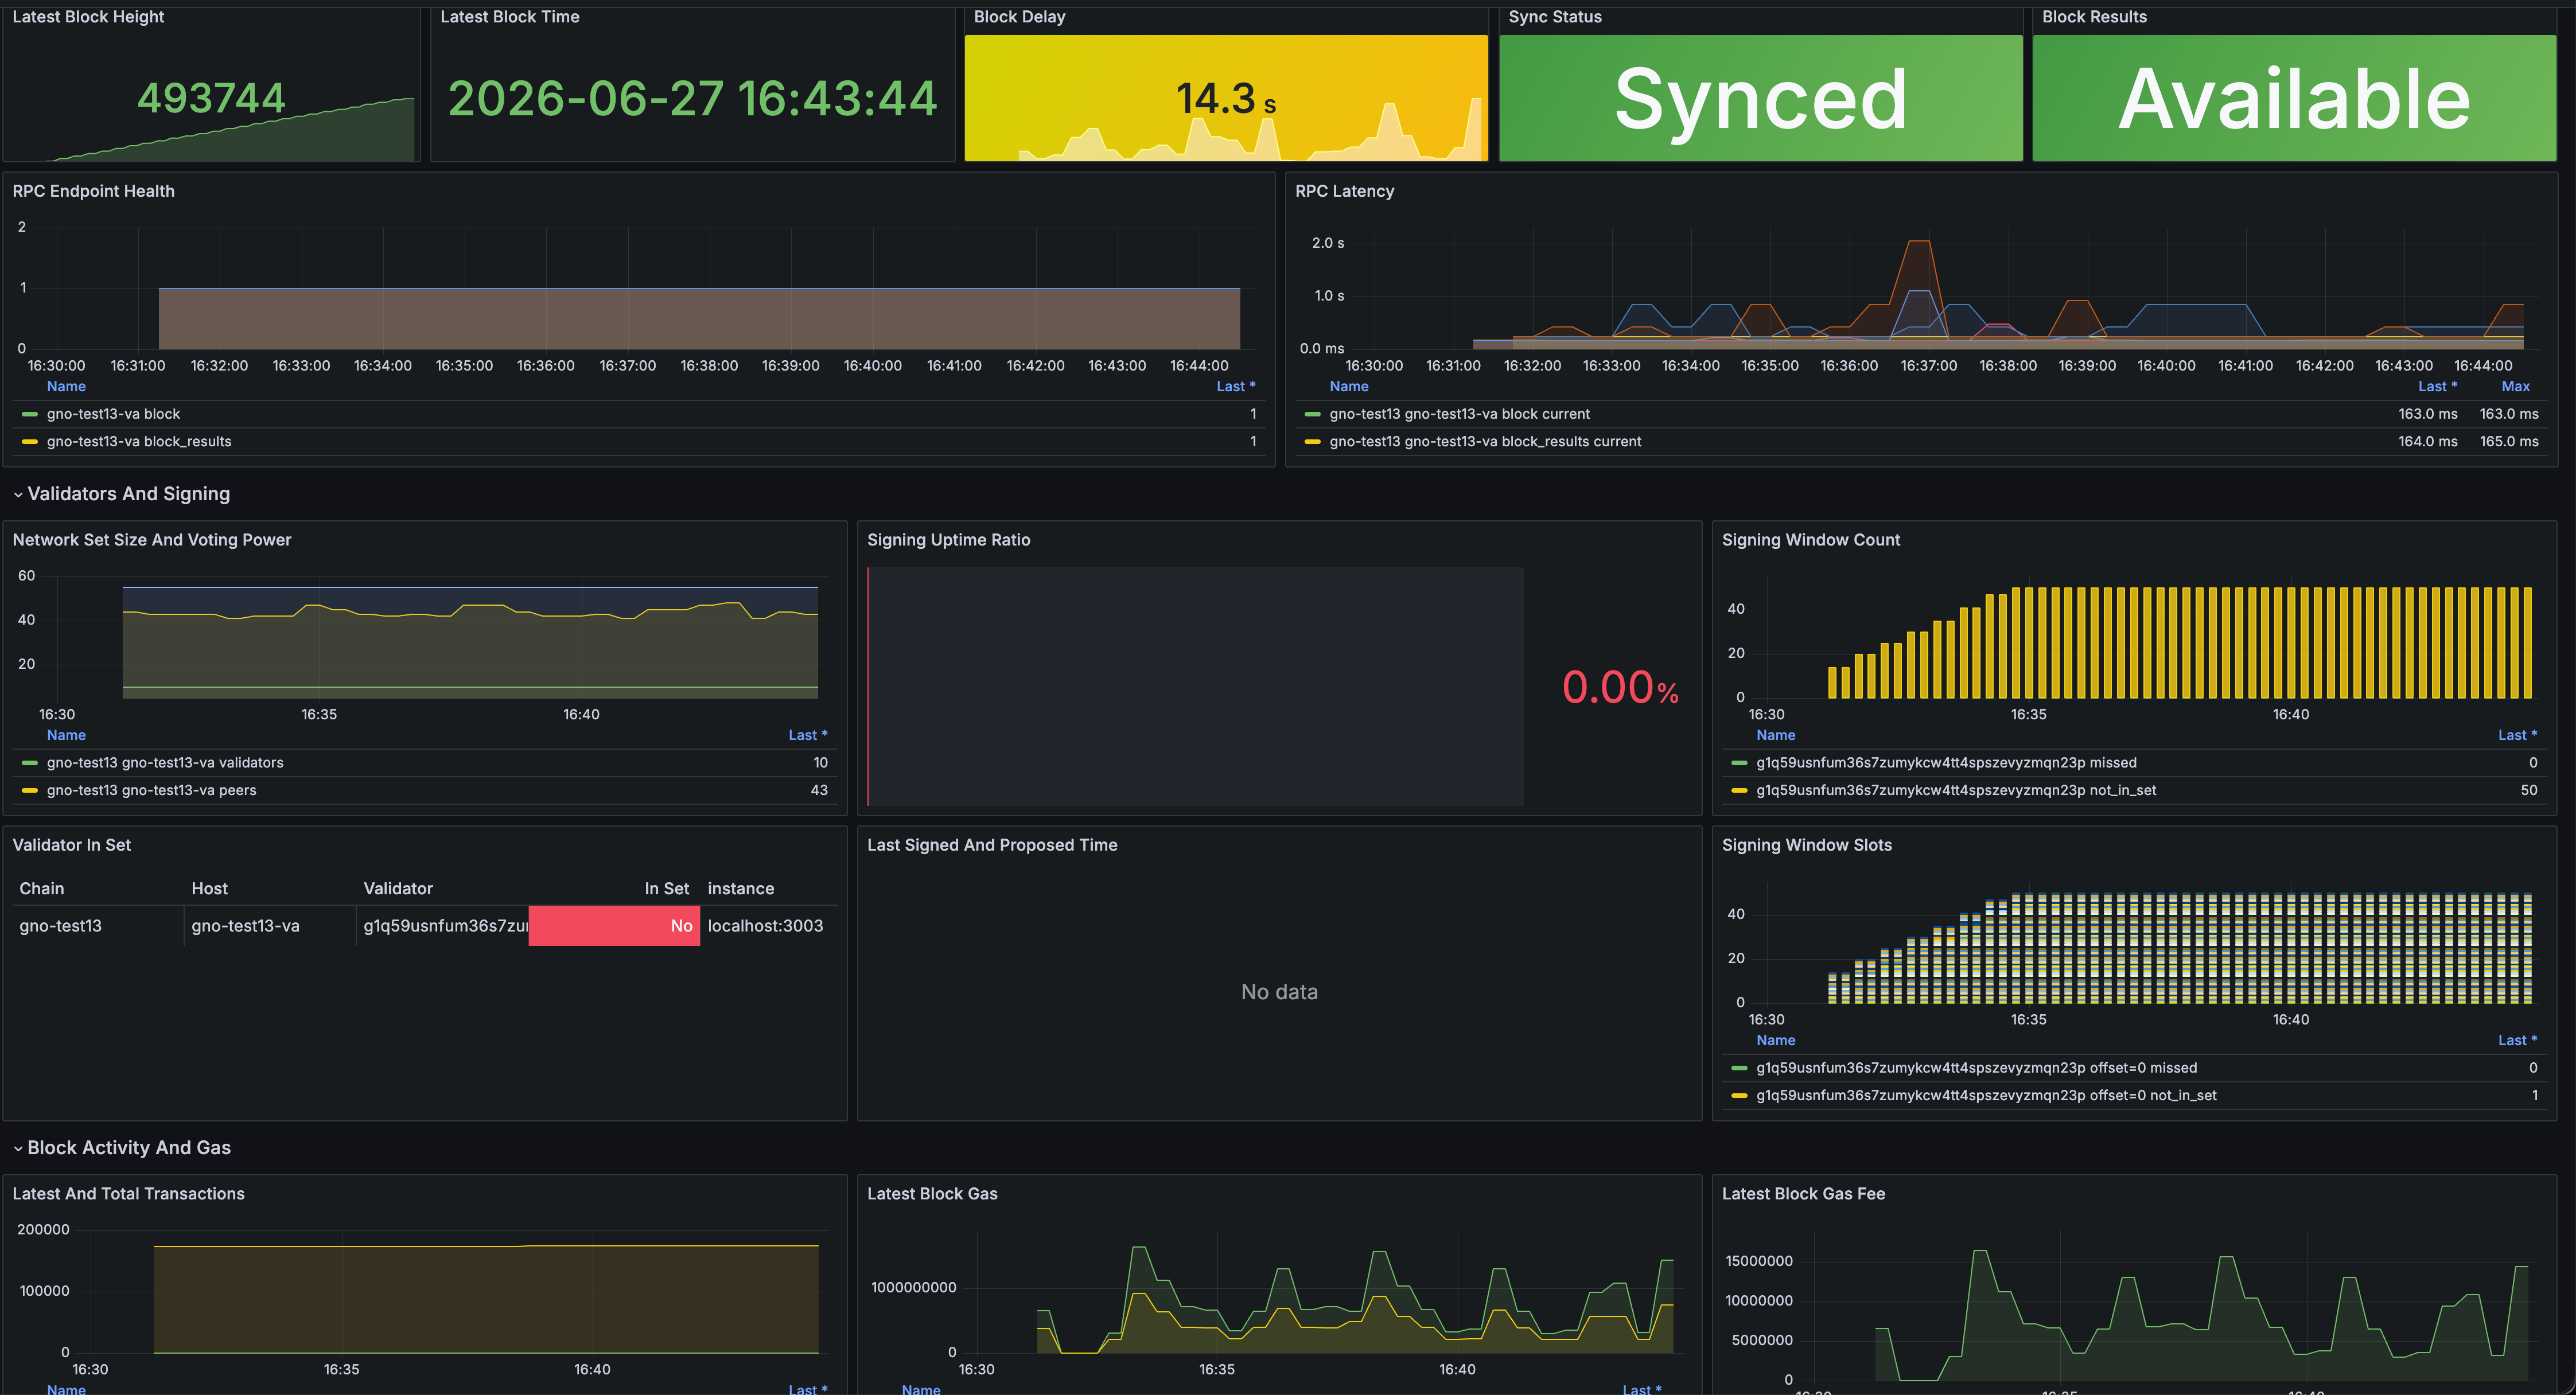
The dashboard focuses on live operator views: node status, RPC health and latency, validator signing, and latest block gas.
Metrics
Node health:
gno_node_health_statusgno_node_endpoint_response_time_millisecondsgno_node_rpc_requests_totalgno_node_latest_block_heightgno_node_latest_block_timestamp_secondsgno_node_block_delay_secondsgno_node_catching_upgno_node_peer_countgno_node_validator_countgno_node_total_voting_power
Latest block gas:
gno_node_block_txsgno_node_total_txsgno_node_gas_wantedgno_node_gas_usedgno_node_gas_fee_amountgno_node_block_results_available
Validator signing:
gno_validator_in_setgno_validator_signing_window_countgno_validator_signing_uptime_ratiogno_validator_last_signed_timestamp_secondsgno_validator_last_proposed_timestamp_secondsgno_validator_signing_window_slot
Alert Starting Points
| Alert | PromQL | Starting Threshold |
|---|---|---|
| Endpoint down | min_over_time(gno_node_health_status[2m]) == 0 | Page after 5m |
| Node catching up | max_over_time(gno_node_catching_up[5m]) == 1 | Investigate after 10m |
| Block delay high | gno_node_block_delay_seconds > 60 | Investigate after 5m |
| Validator not in set | gno_validator_in_set == 0 | Page after 15m for active validators |
| Signing uptime low | gno_validator_signing_uptime_ratio < 0.90 | Page after 10m |
| No recent signature | time() - gno_validator_last_signed_timestamp_seconds > 300 | Page for active validators |
Signing-window metrics are in memory only. They start empty after process restart and become useful as new blocks are observed.