Story Protocol Node Monitor
A monitoring tool for Story Protocol nodes supporting EVM-compatible and CometBFT-based networks. It exposes Prometheus metrics for node health, block processing delays, endpoint response times, and connection status.
Features
- Story-focused: Monitor EL and CL nodes used by Story Protocol
- Prometheus Metrics: Export detailed metrics for monitoring and alerting
- Real-time Monitoring: Subscribe to new blocks and track processing delays
- Health Checks: Monitor endpoint availability and response times
- Grafana Integration: Pre-built dashboard for visualization
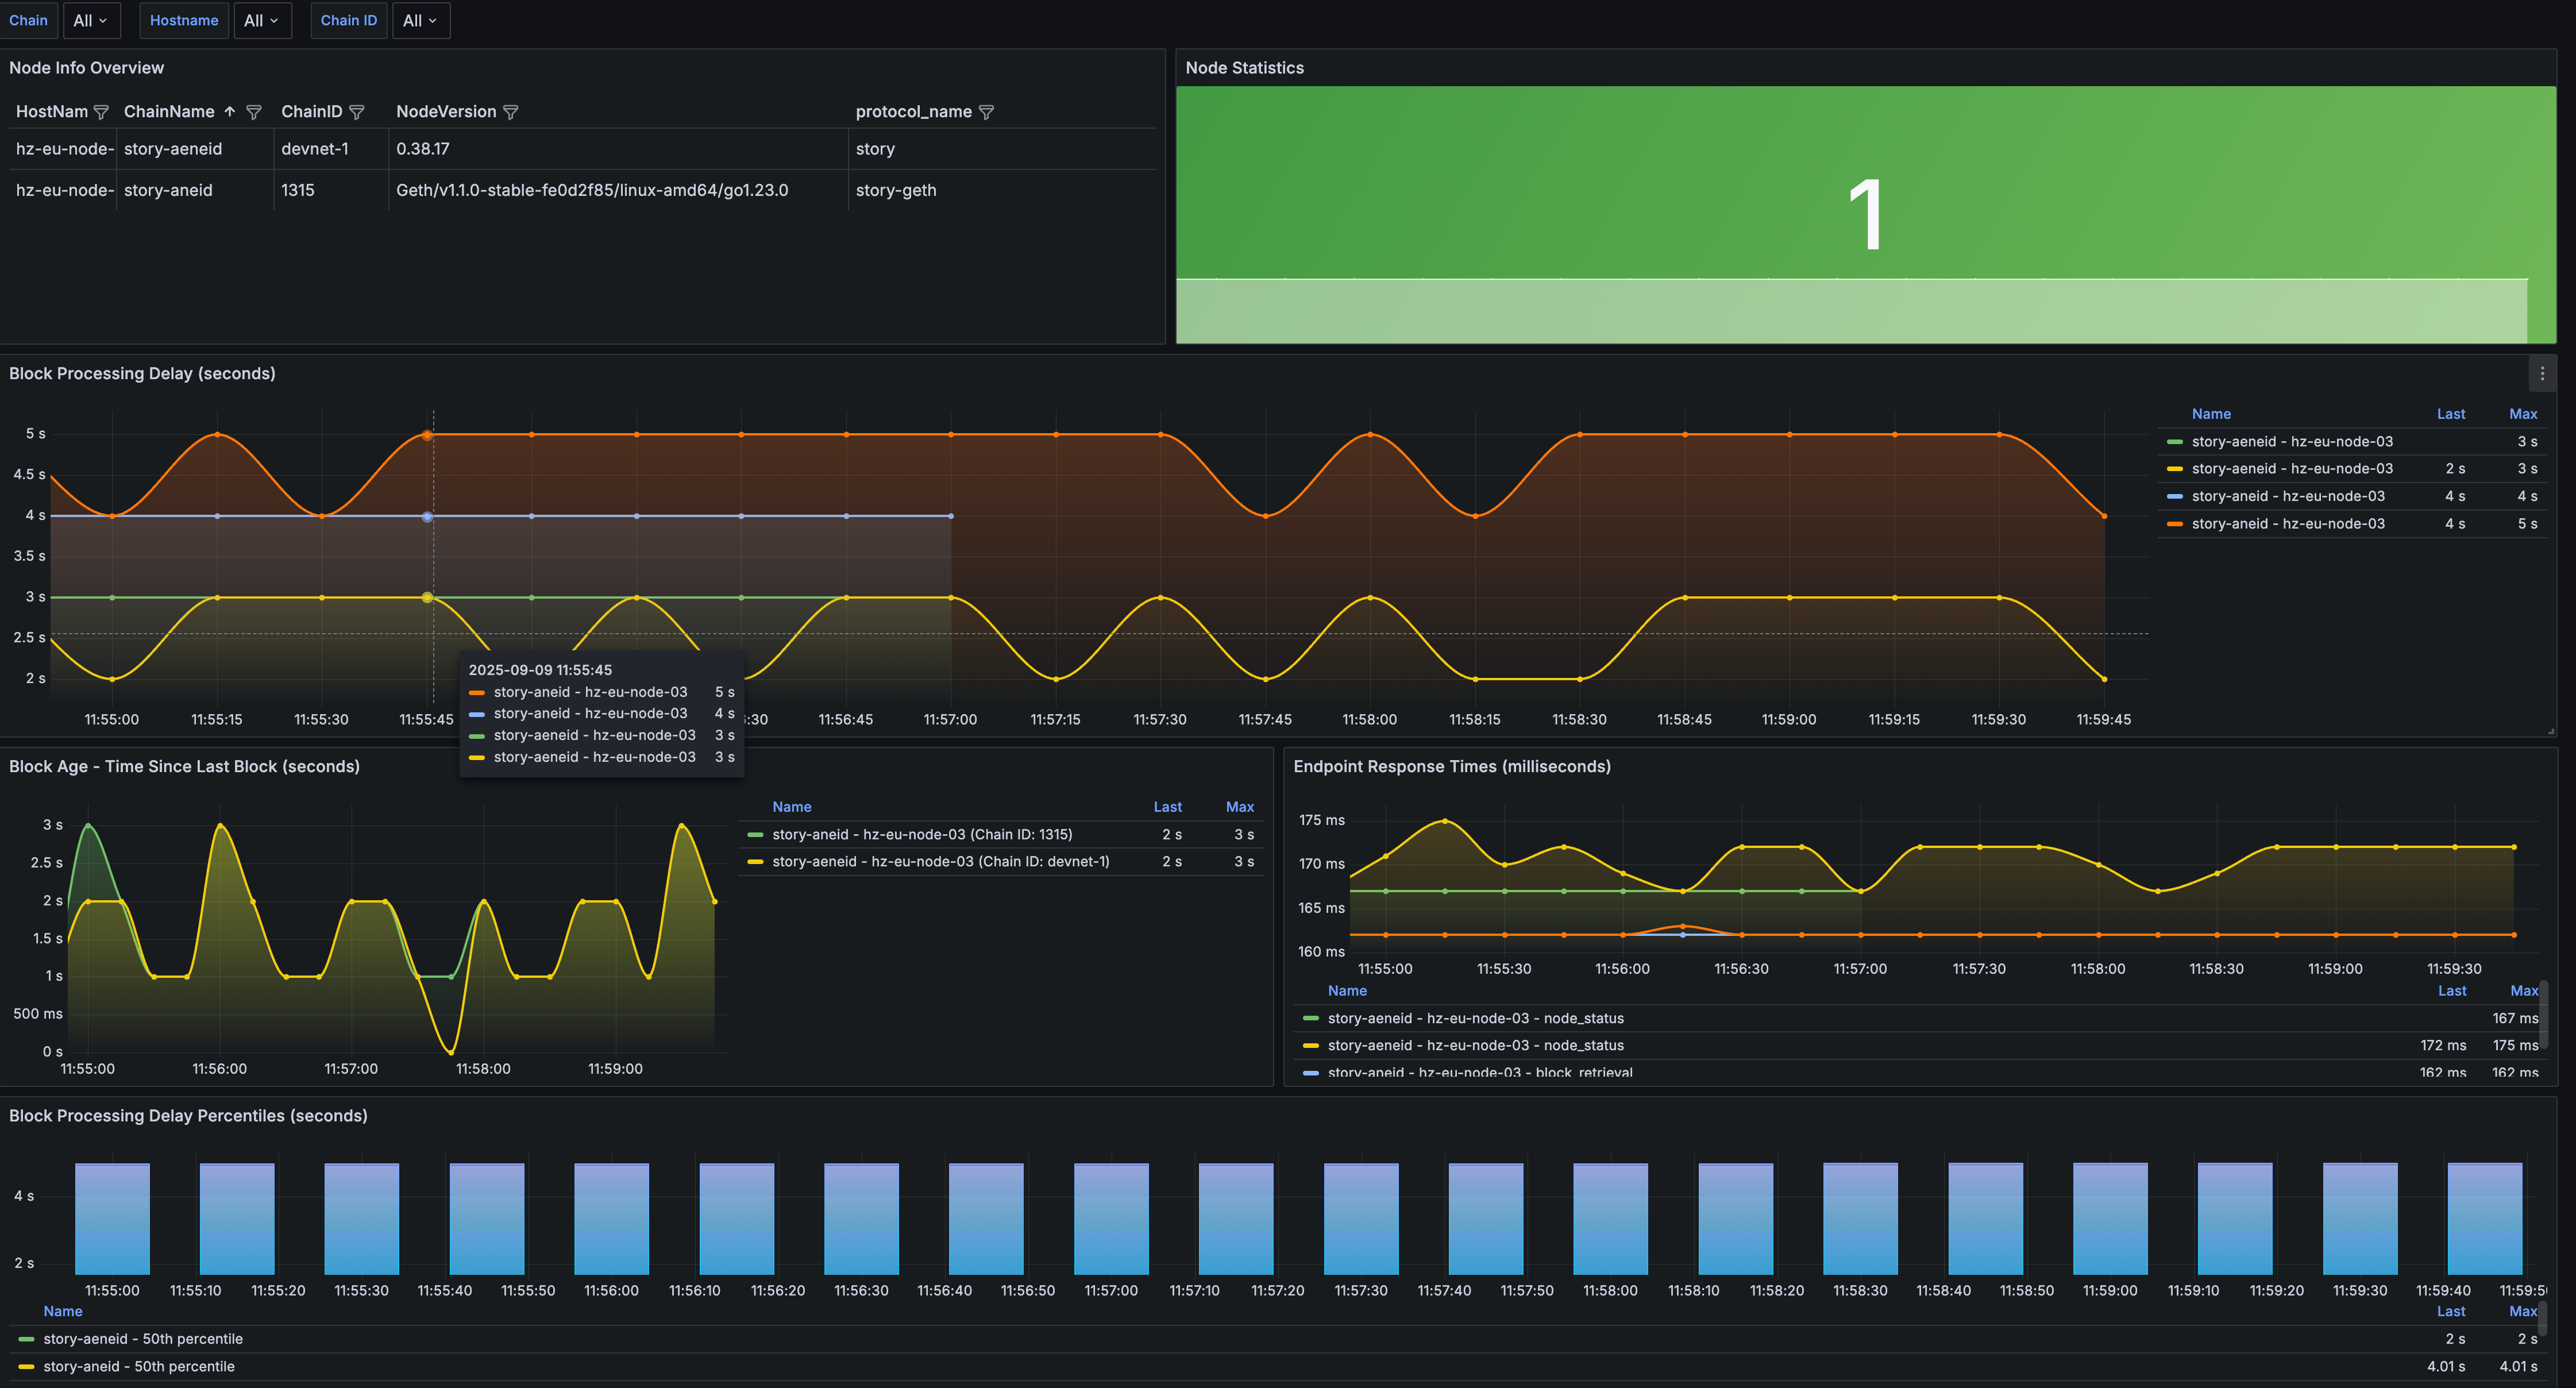
Grafana Dashboard
The tool includes a pre-configured Grafana dashboard for comprehensive visualization. Import the provided grafana-dashboard.json into your Grafana instance to monitor:
- Node health status and availability
- Block processing delays and trends
- Endpoint response times
- Connection success rates
- Historical performance data
Dashboard Components
The monitoring dashboard provides several key visualization panels:
- Overview Panel: Summary status of all monitored nodes
- Health Status: Real-time health indicators with color-coded status
- Performance Metrics: Response times and processing delays with trend analysis
- Network Statistics: Block heights, sync status, and network information
- Alerts Panel: Visual indicators for active alerts and issues
Supported Networks
EVM Compatible Chains
- Story Protocol EVM nodes
- Any EVM-compatible chain with standard JSON-RPC interface
CometBFT-based Chains
- Story Protocol CometBFT nodes
- Any CometBFT-based chain with standard RPC interface
Metrics Overview
The monitor exports comprehensive Prometheus metrics:
Block Processing Metrics
story_node_last_block_timestamp_seconds: Timestamp of the last processed blockstory_node_block_processing_delay_seconds: Delay between block creation and processingstory_node_block_processing_delay_histogram_seconds: Histogram of block processing delays
Node Health Metrics
story_node_health_status: Health status of node endpoints (1=healthy, 0=unhealthy)story_node_endpoint_response_time_milliseconds: Current response time for endpointsstory_node_endpoint_response_time_histogram_milliseconds: Histogram of response times
Connection Metrics
story_node_rpc_connections_count: Total number of RPC connection attempts
All metrics include labels for:
chain_name,hostnamechain_id,node_version,protocol_name(informational)endpoint_type,connection_type,result
Installation
Prerequisites
- Go 1.22 or later
- Access to blockchain node RPC endpoints
Build from Source
git clone https://github.com/ronnynth/storymonitor.git
cd storymonitor
go mod download
go build -o storymonitor main.go
Using Docker
docker build -t storymonitor .
docker run -v $(pwd)/config.yaml:/app/config.yaml -p 3002:3002 storymonitor
Configuration
Create a config.yaml file based on the example below:
# EVM-compatible chains
evm:
  - hostname: "story-geth-node-01"
    http_url: "http://127.0.0.1:8545"
    ws_url: "ws://127.0.0.1:8546"
    chain_name: "story-aneid"
    protocol_name: "story-geth"
    check_second: 5

# CometBFT-based chains
cometbft:
  - hostname: "story-node-01"
    http_url: "http://127.0.0.1:26657"
    chain_name: "story-aeneid"
    protocol_name: "story"
    ws_endpoint: "/websocket"
    check_second: 5
Configuration Parameters
Common Parameters
hostname,chain_namechain_id(auto-detected if empty),node_version(auto-detected)check_second: Health check interval in seconds
EVM-specific Parameters
http_url: HTTP JSON-RPC endpointws_url: WebSocket JSON-RPC endpoint
CometBFT-specific Parameters
http_url: CometBFT RPC endpointws_endpoint: WebSocket endpoint path (default: "/websocket")
Usage
Starting the Monitor
# Using default config file (./config.yaml)
./storymonitor

# Using custom config file
./storymonitor -conf /path/to/config.yaml -logtostderr=true -v=5
Command Line Options
-conf: Path to configuration file (default: "./config.yaml")
Accessing Monitoring Data
Once running, access monitoring data through these endpoints:
- Metrics Endpoint:
http://localhost:3002/metrics - Health Status: Monitor connection status through logs
- Debug Endpoint:
http://localhost:6062/debug/pprof/(pprof profiling)
Monitoring Setup
Prometheus Configuration
Add the following to your prometheus.yml:
scrape_configs:
  - job_name: 'story-nodes'
    static_configs:
      - targets: ['localhost:3002']
    scrape_interval: 15s
    metrics_path: /metrics
Alerting Rules
Example Prometheus alerting rules for proactive monitoring:
groups:
  - name: story-nodes
    rules:
      - alert: NodeDown
        expr: story_node_health_status == 0
        for: 2m
        labels:
          severity: critical
        annotations:
          summary: "Node {{ $labels.hostname }} is down"

      - alert: HighBlockDelay
        expr: story_node_block_processing_delay_seconds > 10
        for: 5m
        labels:
          severity: critical
        annotations:
          summary: "High block processing delay on {{ $labels.hostname }}"

      - alert: OldBlockAge
        expr: story_node_last_block_timestamp_seconds > 60
        for: 3m
        labels:
          severity: critical
        annotations:
          summary: "Old block age on {{ $labels.hostname }}"
Common Use Cases
Development
Project Structure
storymonitor/
├── base/                   # Core metrics definitions
├── cometbft/               # CometBFT implementation
├── conf/                   # Configuration structures
├── evm/                    # EVM chain implementation
├── sched/                  # Scheduler and controller
├── config.yaml.example     # Configuration template
├── grafana-dashboard.json  # Grafana dashboard
└── main.go                 # Application entry point
Adding New Chain Types
- Create a new package in the project root
- Implement the
base.CheckerTraitinterface - Add configuration struct to
conf/conf.go - Register the new checker in
sched/sched.go
Best Practices
Troubleshooting
- Verify RPC endpoints are reachable
- Reduce check intervals if needed
- Use pprof for profiling:
http://localhost:6062/debug/pprof/