Aztec Monitor
A specialized Prometheus-based monitoring tool for Aztec Sequencer nodes. This tool provides comprehensive monitoring capabilities for Aztec L2 network nodes, including node health, block processing status, L1 balance monitoring, and P2P connectivity tracking.
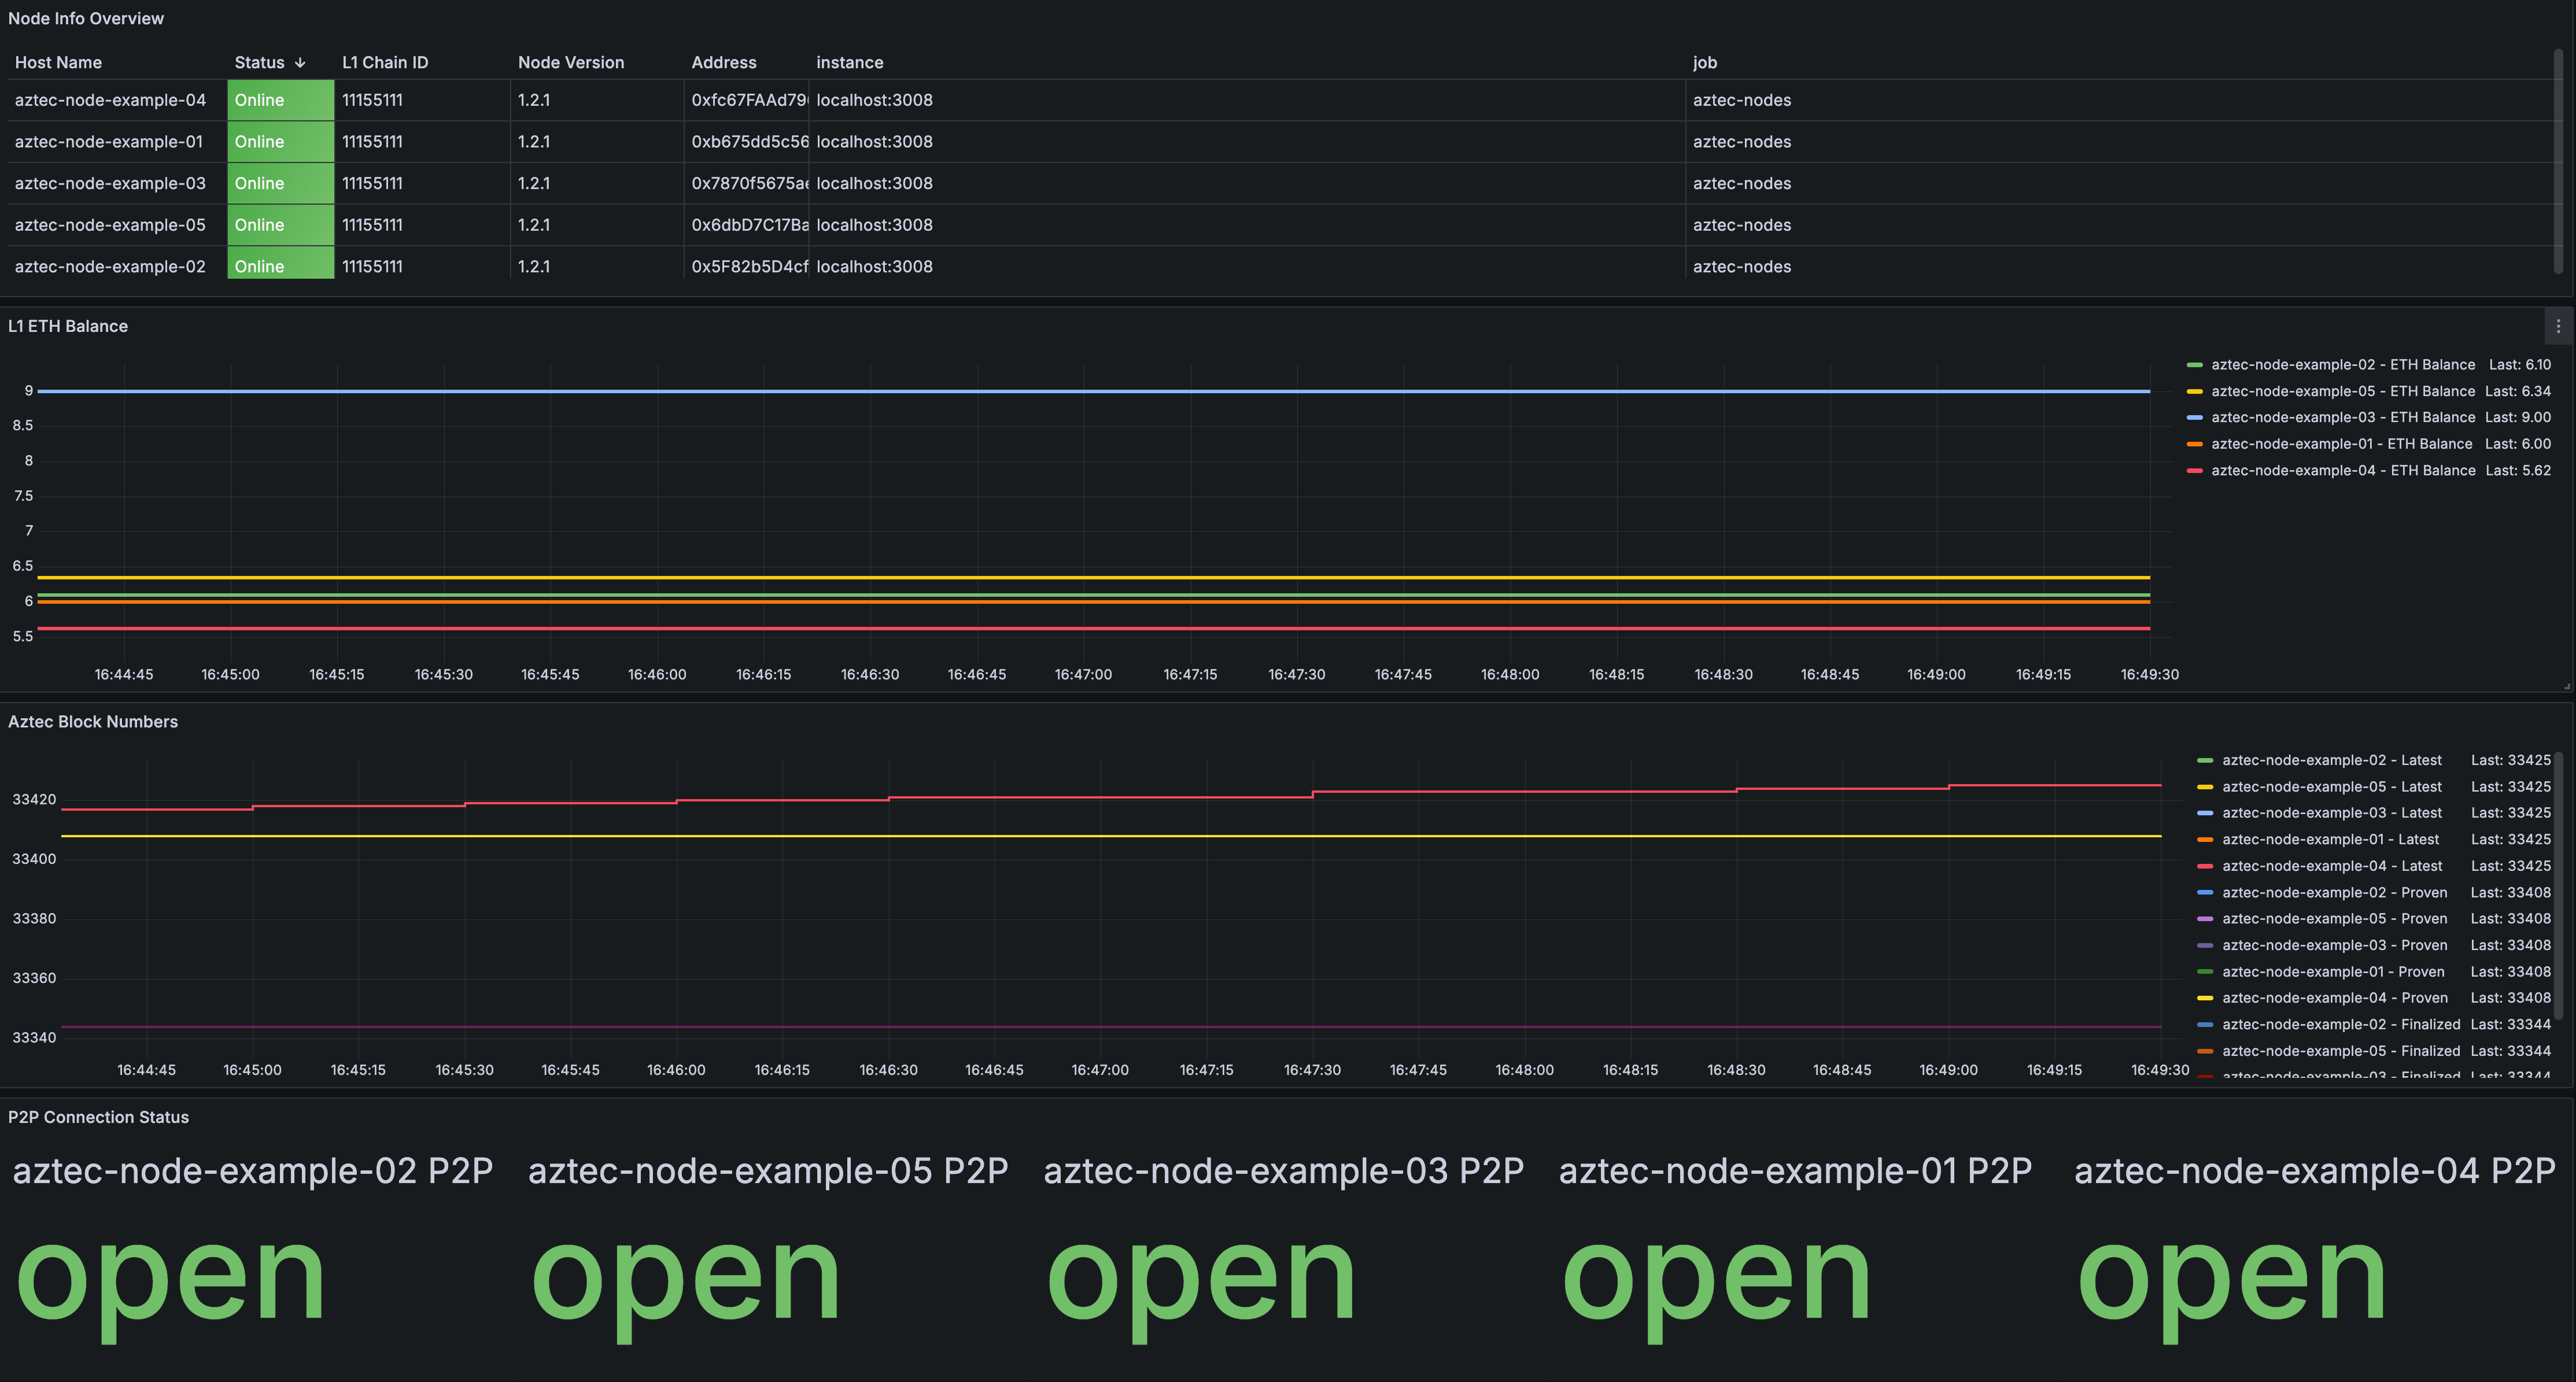
Grafana Dashboard
The tool includes a pre-configured Grafana dashboard for comprehensive visualization. Import the provided grafana-dashboard.json into your Grafana instance to monitor:
- Aztec node health status and availability
- L2 block processing status (latest, proven, finalized)
- L1 ETH balance monitoring for sequencer addresses
- P2P connectivity status and network health
- Node version and L1 chain information
Dashboard Components
The monitoring dashboard provides several key visualization panels:
- Overview Panel: Summary status of all monitored Aztec nodes
- Health Status: Real-time health indicators with color-coded status
- Block Status: Latest, proven, and finalized block numbers with sync status
- Balance Monitoring: L1 ETH balance tracking for sequencer addresses
- Network Statistics: P2P connectivity, node versions, and chain information
- Alerts Panel: Visual indicators for active alerts and node issues
Supported Networks
Aztec Protocol
- Aztec Sequencer nodes
- Aztec L2 network infrastructure
L1 Integration
- Ethereum Mainnet/Sepolia (for balance monitoring)
Metrics Overview
Node Health Metrics
aztec_node_status: Health status of Aztec node (1=healthy, 0=unhealthy)
Block Status Metrics
aztec_latest_number: Latest block number on Aztec L2aztec_proven_number: Latest proven block number on Aztec L2aztec_finalized_number: Latest finalized block number on Aztec L2
Balance Monitoring Metrics
address_l1_balance: L1 ETH balance of the monitored sequencer address
Network Connectivity Metrics
aztec_p2p_status: P2P TCP port connectivity status (1=connected, 0=disconnected)
All metrics include comprehensive labels:
host_name: Name of the monitored Aztec nodehost_ip: IP address of the monitored nodenode_version: Version of the Aztec node softwarel1_chain_id: L1 chain identifier (Ethereum network)address: Monitored Ethereum address for balance tracking
Installation
Prerequisites
- Go 1.23.6 or later
- Access to Aztec node RPC endpoint
- Access to L1 Ethereum RPC endpoint
Build from Source
# Clone the repository
git clone https://github.com/ronnynth/aztecmonitor.git
cd aztecmonitor

# Download dependencies
go mod download

# Build the binary
go build -o aztecmonitor
Configuration
Create a config.yaml file based on the example below:
server:
  http_port: 3008    # Port for metrics and health endpoints
  pprof_port: 6068   # Port for pprof debugging

aztec:
  - host_ip: "127.0.0.1"
    host_name: "aztec-node-01"
    rpc_port: 8080
    tcp_port: 40400
    address: "0x1234567890123456789012345678901234567890"
    l1_chain_rpc: "https://eth-sepolia.g.alchemy.com/v2/YOUR_API_KEY"
    check_second: 30

  - host_ip: "192.168.1.100"
    host_name: "aztec-node-02"
    rpc_port: 8080
    tcp_port: 40400
    address: "0xabcdefabcdefabcdefabcdefabcdefabcdefabcd"
    l1_chain_rpc: "https://eth-sepolia.g.alchemy.com/v2/YOUR_API_KEY"
    check_second: 30
Configuration Parameters
Server Configuration
http_port: Port for metrics and health endpoints (default: 3008)pprof_port: Port for pprof debugging endpoint (default: 6068)
Aztec Node Configuration
host_ip: IP address of the Aztec nodehost_name: Friendly name for the node (used in metrics labels)rpc_port: JSON-RPC port of the Aztec node (default: 8080)tcp_port: P2P TCP port to check connectivity (default: 40400)address: Ethereum address to monitor L1 balancel1_chain_rpc: L1 Ethereum RPC endpoint for balance checkscheck_second: Check interval in seconds (default: 30)
Usage
Starting the Monitor
# Use default config file (./config.yaml)
./aztecmonitor

# Use custom config file with verbose logging
./aztecmonitor -conf /path/to/config.yaml -logtostderr=true -v=5
Accessing Monitoring Data
Once running, access monitoring data through these endpoints:
- Metrics Endpoint:
http://localhost:3008/metrics - Health Check:
http://localhost:3008/health - Debug Endpoint:
http://localhost:6068/debug/pprof/(pprof profiling)
API Endpoints Used
The monitor uses the following Aztec node API endpoints:
- node_getNodeInfo: Retrieves node version and L1 chain ID
- node_isReady: Checks if the node is ready and healthy
- node_getL2Tips: Gets latest, proven, and finalized block numbers
- eth_getBalance: Queries L1 balance (via L1 RPC endpoint)
Monitoring Setup
Prometheus Configuration
Add the following to your prometheus.yml:
scrape_configs:
  - job_name: 'aztec-nodes'
    static_configs:
      - targets: ['localhost:3008']
    scrape_interval: 30s
    metrics_path: /metrics
Alerting Rules
Example Prometheus alerting rules for proactive monitoring:
groups:
  - name: aztec-nodes
    rules:
      - alert: AztecNodeDown
        expr: aztec_node_status == 0
        for: 3m
        labels:
          severity: critical
        annotations:
          summary: "Aztec node {{ $labels.hostname }} is down"
          description: "Aztec Node {{ $labels.hostname }} has been unhealthy for more than 3 minutes"

      - alert: BalanceLow
        expr: address_l1_balance < 1
        for: 5m
        labels:
          severity: warning
        annotations:
          summary: "Aztec node {{ $labels.hostname }} address balance is low(<1 ETH)"
          description: "Aztec node {{ $labels.hostname }} address balance is low(<1 ETH)"
Best Practices
Configuration Optimization
- Set appropriate
check_secondintervals (30s recommended for Aztec nodes) - Monitor multiple sequencer addresses for comprehensive balance tracking
- Use reliable L1 RPC endpoints with good uptime for accurate balance monitoring
- Configure both primary and backup nodes for redundancy
Dashboard Usage
- Regularly review block lag trends to identify performance issues
- Monitor version consistency across nodes
- Set up automated reports for sequencer operational status
- Use dashboard filtering to focus on specific nodes or time periods
Security Considerations
- Protect configuration files containing L1 RPC endpoints
- Use read-only RPC endpoints when possible
- Regularly rotate API keys for L1 RPC providers
- Monitor for unusual balance changes that might indicate security issues
Requirements
- Go 1.23.6 or later
- Access to Aztec node RPC endpoints
- Access to L1 Ethereum RPC endpoint (for balance monitoring)
- Network connectivity to monitor P2P ports
By implementing Aztec Monitor with proper configuration and monitoring practices, you can ensure reliable Aztec L2 infrastructure operation and proactive issue resolution.