Blockchain Node Monitor
A comprehensive monitoring solution for blockchain nodes supporting EVM-compatible chains, Cosmos networks, and Ethereum Beacon Chain. This tool provides Prometheus metrics for monitoring node health, block processing delays, endpoint response times, and connection status.
Grafana Dashboard
The tool includes a pre-configured Grafana dashboard for comprehensive visualization. Import the provided grafana-dashboard.json into your Grafana instance to monitor:
- Node health status and availability
- Block processing delays and trends
- Endpoint response times
- Connection success rates
- Historical performance data
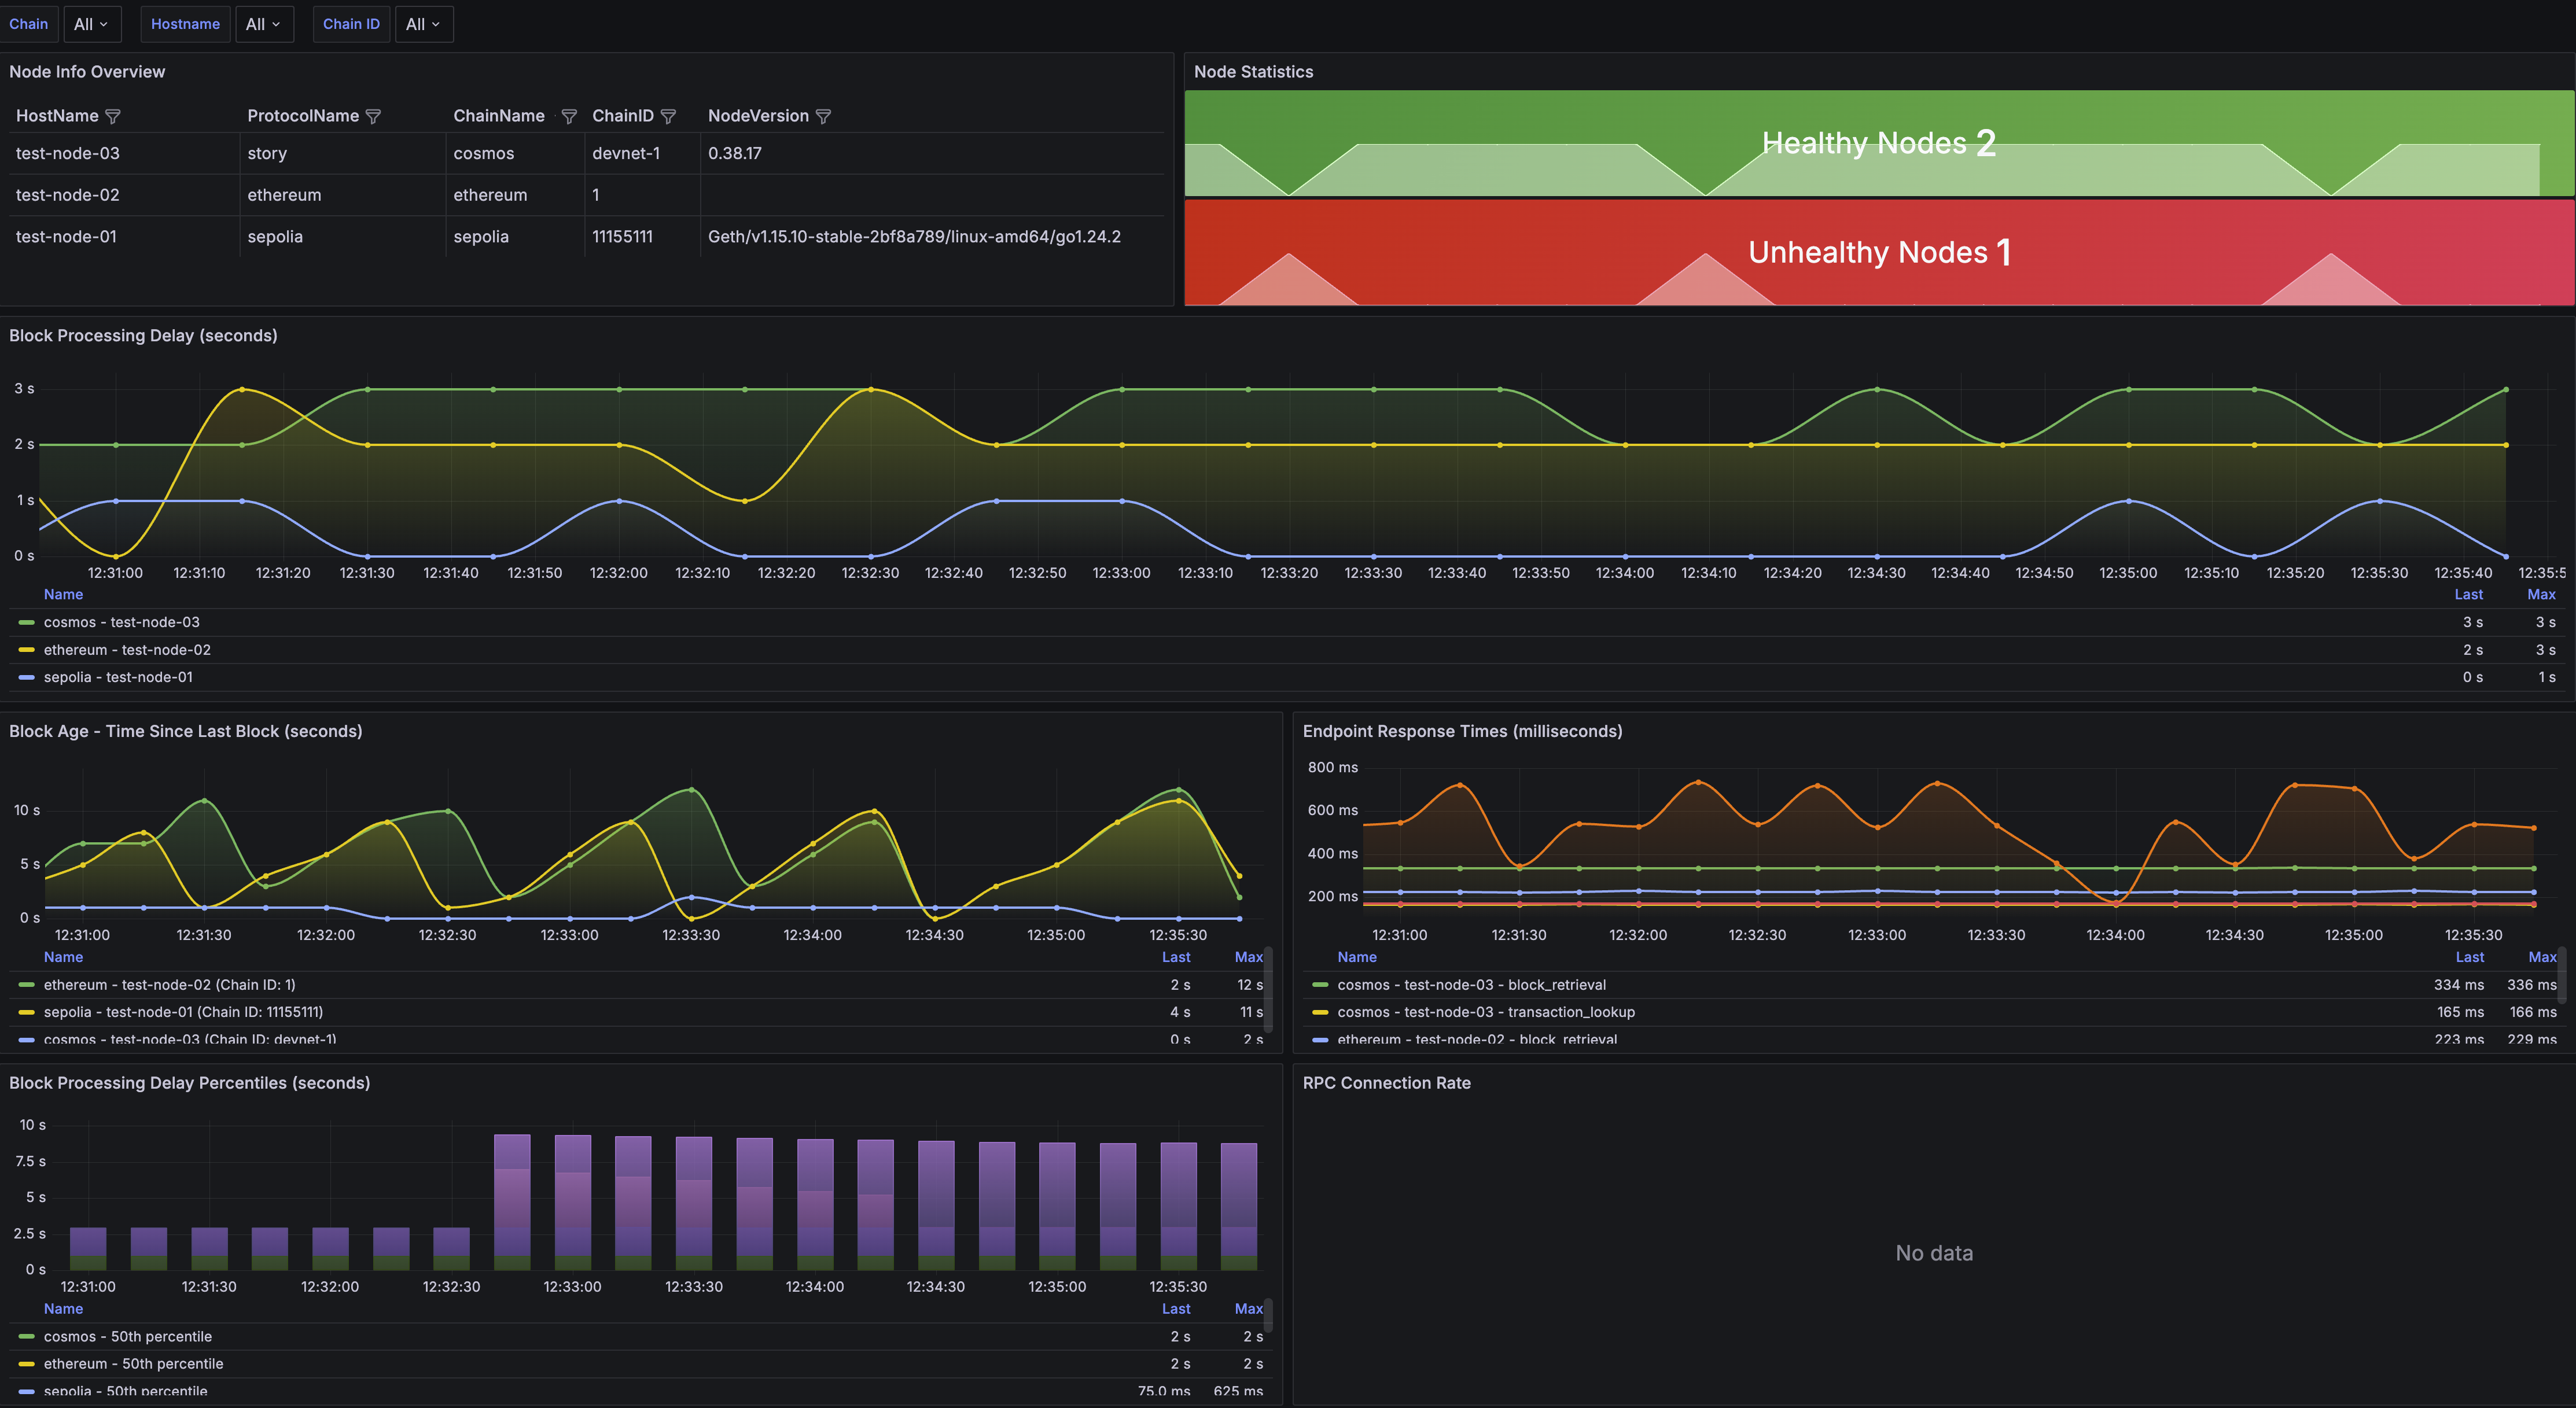
Dashboard Components
The monitoring dashboard provides several key visualization panels:
- Overview Panel: Summary status of all monitored nodes
- Health Status: Real-time health indicators with color-coded status
- Performance Metrics: Response times and processing delays with trend analysis
- Network Statistics: Block heights, sync status, and network information
- Alerts Panel: Visual indicators for active alerts and issues
Supported Networks
EVM Compatible Chains
- Ethereum Mainnet/Testnets
- Polygon
- Binance Smart Chain
- Arbitrum
- Optimism
- Any EVM-compatible chain with standard JSON-RPC interface
Cosmos Ecosystem
- Cosmos Hub
- Osmosis
- Juno
- Any Cosmos SDK-based chain with CometBFT consensus
Ethereum Beacon Chain
- Ethereum 2.0 Beacon Chain
- Compatible with major consensus clients (Lighthouse, Prysm, Teku, Nimbus)
Metrics Overview
The monitor exports comprehensive Prometheus metrics:
Block Processing Metrics
blockchain_node_last_block_timestamp_seconds: Timestamp of the last processed blockblockchain_node_block_processing_delay_seconds: Delay between block creation and processingblockchain_node_block_processing_delay_histogram_seconds: Histogram of block processing delays
Node Health Metrics
blockchain_node_health_status: Health status of node endpoints (1=healthy, 0=unhealthy)blockchain_node_endpoint_response_time_milliseconds: Current response time for endpointsblockchain_node_endpoint_response_time_histogram_milliseconds: Histogram of response times
Connection Metrics
blockchain_node_rpc_connections_count: Total number of RPC connection attempts
All metrics include comprehensive labels:
chain_name: Blockchain network namehostname: Node identifierchain_id: Chain identifiernode_version: Node software versionendpoint_type: Type of endpoint being monitoredconnection_type: Connection type (http/ws)result: Connection attempt result (success/fail)
Installation
Prerequisites
- Go 1.22 or later
- Access to blockchain node RPC endpoints
Build from Source
git clone https://github.com/ronnynth/chainmonitor.git
cd chainmonitor
go mod download
go build -o chainmonitor main.go
Using Docker
docker build -t chainmonitor .
docker run -v $(pwd)/config.yaml:/app/config.yaml -p 3002:3002 chainmonitor
Configuration
Create a config.yaml file based on the example below:
# EVM-compatible chains
evm:
  - hostname: "ethereum-mainnet"
    http_url: "https://mainnet.infura.io/v3/YOUR_PROJECT_ID"
    ws_url: "wss://mainnet.infura.io/ws/v3/YOUR_PROJECT_ID"
    chain_name: "ethereum-execution"
    protocol_name: "ethereum"
    check_second: 5

# Cosmos-based chains
cometbft:
  - hostname: "cosmos-hub"
    http_url: "https://rpc.cosmos.network:443"
    chain_name: "cosmos"
    protocol_name: "story"
    ws_endpoint: "/websocket"
    check_second: 5

# Ethereum Beacon Chain
beacon:
  - hostname: "ethereum-beacon"
    http_url: "https://beacon-api-endpoint"
    chain_name: "ethereum-beacon"
    protocol_name: "ethereum"
    check_second: 15
Configuration Parameters
Common Parameters
hostname: Unique identifier for the nodechain_name: Blockchain network nameprotocol_name: Blockchain protocol namecheck_second: Health check interval in seconds
EVM-Specific Parameters
http_url: HTTP JSON-RPC endpoint URLws_url: WebSocket JSON-RPC endpoint URL
Cosmos-Specific Parameters
http_url: CometBFT RPC endpoint URLws_endpoint: WebSocket endpoint path (default: "/websocket")
Beacon Chain-Specific Parameters
http_url: Beacon API endpoint URL
Usage
Starting the Monitor
# Use default config file (./config.yaml)
./chainmonitor

# Use custom config file with verbose logging
./chainmonitor -conf /path/to/config.yaml -logtostderr=true -v=5
Command Line Options
-conf: Path to configuration file (default: "./config.yaml")-logtostderr: Log to stderr instead of files-v: Verbosity level for logging
Accessing Monitoring Data
Once running, access monitoring data through these endpoints:
- Metrics Endpoint:
http://localhost:3002/metrics - Health Status: Monitor connection status through logs
- Debug Endpoint:
http://localhost:6062/debug/pprof/(pprof profiling)
Monitoring Setup
Prometheus Configuration
Add the following to your prometheus.yml:
scrape_configs:
  - job_name: 'blockchain-nodes'
    static_configs:
      - targets: ['localhost:3002']
    scrape_interval: 15s
    metrics_path: /metrics
Alerting Rules
Example Prometheus alerting rules for proactive monitoring:
groups:
  - name: blockchain-nodes
    rules:
      - alert: NodeDown
        expr: blockchain_node_health_status == 0
        for: 2m
        labels:
          severity: critical
        annotations:
          summary: "Blockchain node {{ $labels.hostname }} is down"
          description: "Node {{ $labels.hostname }} has been unreachable for more than 2 minutes"

      - alert: HighBlockDelay
        expr: blockchain_node_block_processing_delay_seconds > 60
        for: 5m
        labels:
          severity: warning
        annotations:
          summary: "High block processing delay on {{ $labels.hostname }}"
          description: "Block processing delay is {{ $value }} seconds on {{ $labels.hostname }}"

      - alert: HighResponseTime
        expr: blockchain_node_endpoint_response_time_milliseconds > 5000
        for: 3m
        labels:
          severity: warning
        annotations:
          summary: "High response time on {{ $labels.hostname }}"
          description: "Response time is {{ $value }}ms on {{ $labels.hostname }}"
Common Use Cases
Multi-Node Monitoring
Monitor multiple nodes for comparison and redundancy:
evm:
  - hostname: "primary-node"
    http_url: "http://primary-node:8545"
    chain_name: "ethereum"
    check_second: 5
  - hostname: "backup-node"
    http_url: "http://backup-node:8545"
    chain_name: "ethereum"
    check_second: 5
Load Balancer Monitoring
Monitor endpoints behind load balancers to ensure high availability and proper load distribution.
Cross-Network Comparison
Simultaneously monitor testnet and mainnet nodes to compare network performance and stability.
Infrastructure Validation
Validate blockchain infrastructure health before deploying applications or during maintenance windows.
Best Practices
Configuration Optimization
- Set appropriate
check_secondintervals based on network characteristics - Use WebSocket connections when available for real-time block monitoring
- Configure multiple endpoints for critical networks
Alerting Strategy
- Implement tiered alerting (warning → critical)
- Set reasonable thresholds based on network performance baselines
- Include runbooks in alert annotations for faster resolution
Dashboard Usage
- Regularly review historical trends to identify patterns
- Set up automated reports for stakeholder communication
- Use dashboard filtering to focus on specific nodes or time periods
By implementing Chain Monitor with proper configuration and monitoring practices, you can ensure reliable blockchain infrastructure operation and proactive issue resolution.